Top Posts

Understanding your Audience

How to Analyze Qualitative and Quantitative Data
Pexels. User Survey Image. 10 February 2019. Web. https://www.pexels.com/photo/person-writing-on-notebook-669615/.

How to Analyze Qualitative and Quantitative Data

When it comes time to analyze your data it is very important you use the correct methods to achieve accurate results. This post will discuss when to use qualitative and quantitative data, so you can analyze your data accurately and effectively.

Qualitative Vs. Quantitative

Although the words ‘qualitative’ and ‘quantitative’ sound very similar they are in fact two different ways you can collect your user research. It is critical that you understand the differences of the two user research methods before you collect any data or construct questions used for an interview, survey or user study. This will not only allow you to understand what questions you should be testing, but also save you time in the long run.

Qualitative

Qualitative methods include but are not limited to; surveys, analytics, and formal experiments (Mortensen, D. Par. 2, 2019). This user research method allows the researcher to measure aspects of the user and user behavior in a way that can be quantified and used for statistical analysis. The best way to collect qualitative data is to collect objective measurements. Objective measurements are measurements that are unbiased by the researcher’s hypotheses, presence, and personality (Mortensen, D. Par. 4, 2019).

Qualitative data provides a more in-depth understanding of the individual. The results are not expressed numerically, but rather as themes or categories that have occurred during the research.

  • Approach: Subjective
  • Analysis: Non-Statistical
  • Collection of Data: Unstructured
  • Determines: Depth of Understanding
  • Asks: Why? (Often open-ended)
  • Outcome: Develops initial understanding

Quantitative

Quantitative data collection is a method in which data can be numerically collected. This method is easier to collect than qualitative data collection and will increase the speed it takes to collect results. This data is useful for user studies, experiments manipulated analysis, surveys etc. It is typically represented by tables, charts, histograms and graphs (DB, Difference Between 15 February 2019) and uses measurements like height, length, volume, area, humidity, temperature.

For example:

Height = 2.8m. Or sometimes they represent the exact number like,

Number of students = 234.

  • Approach: Objective
  • Analysis: Statistical
  • Collection of Data: Structured
  • Determines: Level if Occurrence
  • Asks: How often or how much? (Usually)
  • Outcome: Recommends final course of action

Combining Qualitative and Quantitative Data

There are many benefits of combining qualitative and quantitative data. Many researchers combine both of these measurements for their user tests. For an example, you can use quantitative data to represent time and errors with qualitative methods such as observations and interviews. Researchers often times use the words ‘objective’ and ‘subjective’ to describe the data they collected through quantitative and qualitative methods (Mortensen, D. Par. 12-18, 2019). By combining both of these methods you can often times back up your qualitative data better or interpret your results easier.

Sources

Mortensen, Ditte. Interactive Design Foundation. Best Practices for Qualitative Data. 12 February 2019. Web. https://www.interaction-design.org/literature/article/best-practices-for-qualitative-user-research.

Difference Between. Difference Between Qualitative Data And Quantitative Data. 10 February 2019. Web. http://www.differencebetween.net/science/mathematics-statistics/difference-between-qualitative-data-and-quantitative-data/.

Image Source

0 Facebook Twitter Google + Pinterest
The Evolution of a Mental Model – Smartphone Vs. Flip Phone
[1] Pixels Images, Lady holding smartphone. Web. https://www.pexels.com/photo/person-holding-a-smartphone-892757/.
I was surprised to find what I knew about “Mental Models” before diving into our first reading assignments was only a glimpse of what a Mental Model can provide for a User Experience designer. Comparing my mom’s mental model before and after purchasing her first smartphone helped me understand mental models better.

What is a Mental Model?

A mental model is a belief of what your users thinks or knows. What a user believes they know about a user interface of a website or application strongly impacts how they use it. Mental models that derail from the objective are common, especially with interfaces that try something new (Nielsen, 2010 Par. 1-4).

[2] Product Life Cycle illustration. Image based on cartoon #5 at www.usability.uk.com/.

Understanding Mental Models

A great example of a Mental Model is a user using a smartphone for the first time in their life. The decisions they make to interact with the smartphone are based on beliefs of what the users thinks or knows. Have they seen other people use a smartphone before? What is their current occupation? Do they have a background in technology or engineering?

Smartphone vs. Flip Phones

My mom started using a smartphone for the first time in her life this year. Previously, she owned a Kyocera Cadence LTE flip phone. She was very content with the experience she received with her flip phone, however was unable to accomplish tasks that required internet access. 

[1] Image of my mom’s old phone. PC Mag. https://www.google.com/search?q=kyocera%20cadence%20lte%20flip%20phone Web. 24 January 2019. 

In Jakob Nielson’s article we learned that engineers have a ‘deep’ mental model of how TVs work that allows them to work out how to fix them (Nielsen, 2010, Par 4-12). In contrast, my mom does not have a background in engineering or cellular technology. Given this fact her mental model is very different than a user that has never used a smartphone, but does have a background in cellular technology. Although, this combination is extremely unlikely it is possible. Every user’s mental model is different per experience. By using User-Centered Design we can understand my mom’s experience with her new iPhone 8. By employing techniques, processes, and methods throughout the product life cycle we can accomplish this (Kathy, 2015, Page 7).

Evolving Mental Models

With practice and experience comes skills and knowledge. The more my mom became familiar with her new smartphone the more she understood how to use it. During this time, her mental model was shifting closer to a user’s mental model that are more familiar with cellular technology. Although, she frequently runs into issues to complete hard tasks on her iPhone 8 she has been learning from her mistakes. Everyday her smartphone mental model experience strengthens. The speed at which her mental model evolves is up to her beliefs and what she knows. Before I know it my mom’s mental model will evolve closer to an everyday smartphone user.

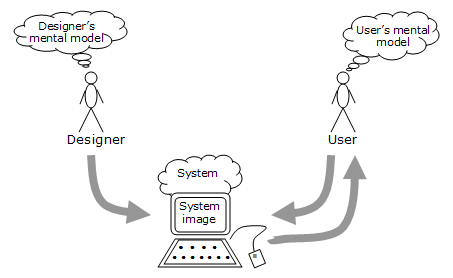
[2] This diagram from Interactive Design’s Metal Model article shows how two users with different backgrounds communicate to a system.

Sources:

Baxter, Kathy. Morgan Kaufmann Publishers Inc. Print. Understanding your Users: A Practical Guide to User Research Methods. July 2015.

Nielsen, Jakob. Mental Models. Nielsen Norman Group. Web. 23 Jan. 2019. https://www.nngroup.com/articles/mental-models/.

Image Sources:

[1] PC Mag. https://www.google.com/search?q=kyocera%20cadence%20lte%20flip%20phone Web. 24 January 2019. 

[2] Interactive Design. https://www.interaction-design.org/literature/book/the-glossary-of-human-computer-interaction/mental-models. Web. 22 January 2019.

[3] Pixels Images, Lady holding smartphone. Web. https://www.pexels.com/photo/person-holding-a-smartphone-892757/.

1 Facebook Twitter Google + Pinterest
The Importance of User Requirements vs. Business Requirements
Pixel Photos. Team Photo. 22 January 2019. Web. https://www.pexels.com/photo/colleagues-cooperation-fist-bump-fists-398532/

Fulfilling your users requirements and business requirements can be tough. However, by taking a holistic view of your users scenarios and needs can allow you to reach both your users requirements and business requirements easier. As a User Experience Designer for Verizon I find it extremely important to understand your targeted audience before starting any project. Whether you are building a mobile application, a new product or website understanding your users will go a long way.

Prior to working on Verizon’s communication team (with a great number of talented co-workers), I was a lead designer for our Personalization Team. On Verizon’s Personalization Team I was responsible for creating experiences that would be used for A/B tests on verizonwireless.com. If you are not familiar with an A/B test that is alright. Before working for Verizon, I was not familiar with the term ‘A/B testing’ before either. An A/B test is way for you to find out if ‘Page A’ preforms better than ‘Page B’. On the Personalization Team we used A/B testing as a way to collect analytics on the performance of copy, design,imagery and experiences between these two web pages.


[1] Verizon Wireless Homepage Homepage Screenshot.

[1] Verizon Wireless Homepage Homepage Screenshot.

The hardest part about being a Lead Designer for the Personalization Team was fulfilling the users requirements and business requirements for our A/B tests. The business requirements always went against brand and best user experience practices. For an example, I would receive requests to make the CTA (Call to action) more prominent and larger, increase the font size or add an explanation mark at the end of our headlines. All of these strategies were severely off Verizon’s brand. However, the Test Leads would insist to give it a go.”It is just a test Diana, only 50% of our prospects would receive this experience on verizonwireless.com.” they would say. It was very difficult to not fall into this trap of using bad practices. Especially, since I knew these strategies would increase our users click ratio. However, would not be the right experience for our users.

To bring our team and Test Leads back on the same page I would present user personas and common user scenarios for each test we preformed whenever we derailed from our user’s requirements. By stressing the importance of designing a holistic experience for our users that was on brand always did the trick for us. Creating personas based on actual user data is a great way to build and improve your product’s UX (Noetzel, 2018, Par 1). This is a very similar lesson “Satisfy the Cat, a.k.a User-Centered Design” video teaches us. Sometimes you just need to put your users’ needs in front of your business partners to bring everyone back on the same page for an assignment.

Sources:

Noetzel, Tim. How To Improve Your Design Process With Data-Based Personas. Web. 24 Jan. 2019. https://www.smashingmagazine.com/2018/04/design-process-data-based-personas/.

Satisfy the Cat, a.k.a User-Centered Design. Web. 24 Jan. 2019. https://www.youtube.com/watch?v=dln9xDsmCoY.

https://www.smashingmagazine.com/2018/04/design-process-data-based-personas/.

Baxter, Kathy. Morgan Kaufmann Publishers Inc. Print. Understanding your Users: A Practical Guide to User Research Methods. July 2015.

Image Sources:

[1] Verizon Wireless. MacBook Pro Screenshot. Web. verizonwireless.com. 25 January 2019.

[2] Pixel Photos. Team Photo. 22 January 2019. Web. https://www.pexels.com/photo/colleagues-cooperation-fist-bump-fists-398532/.

1 Facebook Twitter Google + Pinterest